 (770) 874-6085


 770-874-6085
Chrome 152 soft navigation Core Web Vitals reporting exposes performance problems that can appear after a visitor clicks through a single-page application, even when the initial page load seems fast. This is a practical measurement improvement for teams building React, Next.js and other app-style experiences: the first page can look healthy while a product route, filter, quote step or form interaction feels slow.
Quick Answer
Chrome 152 stable, released August 25, 2026, adds default Live Metrics support for Core Web Vitals during detected client-side soft navigations in single-page applications. DevTools can now help teams investigate LCP and INP after a route changes, rather than looking only at the first document load. The feature is a lab diagnostic, not a direct Google ranking report; combine it with real-user data, analytics and conversion behavior.
Key Facts
| Question | Verified answer |
|---|---|
| Stable status | Chrome 152 stable released August 25, 2026. |
| DevTools change | Live Metrics reports Core Web Vitals for client-side soft navigations by default. |
| Implementation | Chrome attributes the change to web-vitals v6.0.0. |
| Examples | The official post names LCP and INP; teams should also inspect CLS in context. |
| Business interpretation | Use lab diagnostics alongside field data and conversion outcomes. |
What Changed in Chrome 152 Live Metrics?
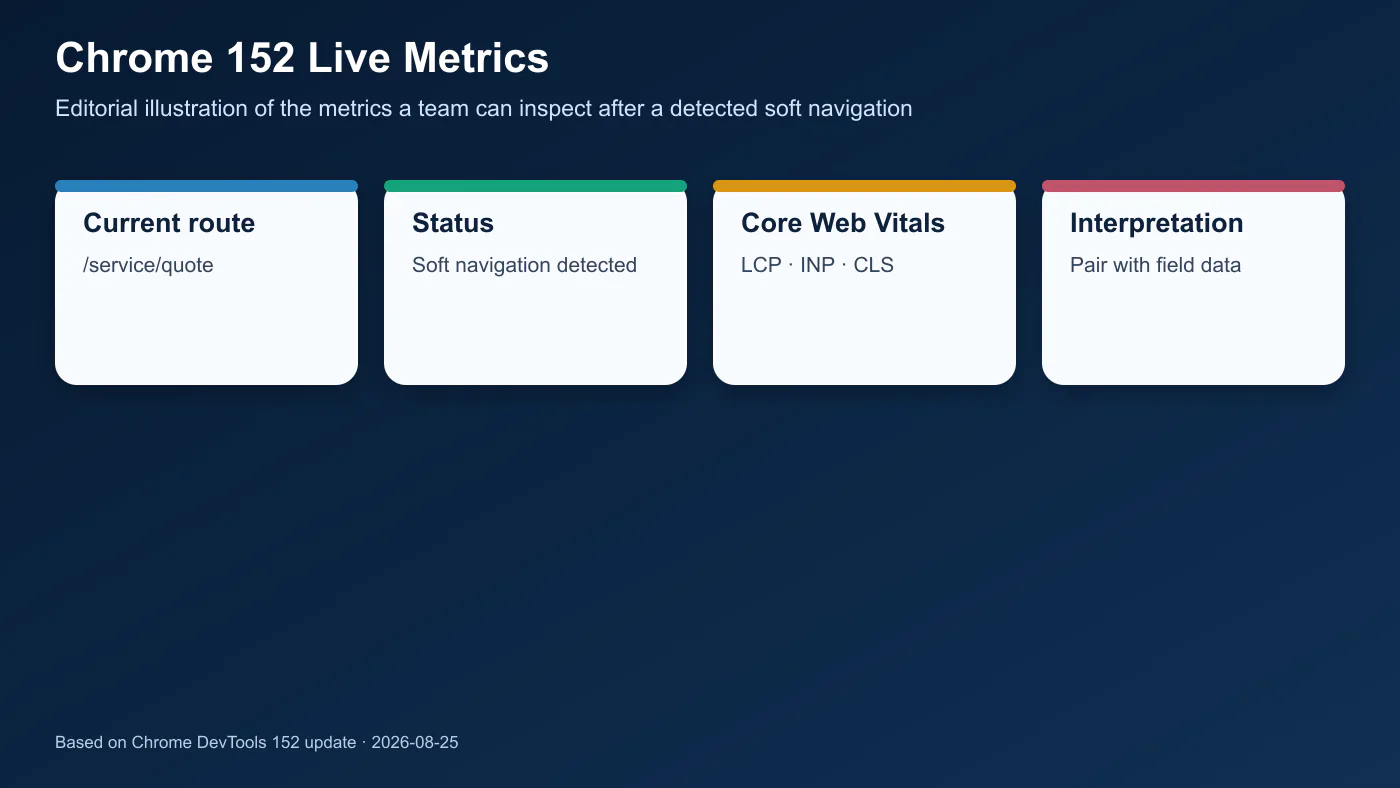
Chrome’s DevTools update published August 25 says Performance Live Metrics now captures and reports Core Web Vitals such as Largest Contentful Paint (LCP) and Interaction to Next Paint (INP) for client-side soft navigations in single-page applications by default. Chrome credits an upgrade to web-vitals v6.0.0. The official Chrome 152 stable release notes confirm August 25 as the stable release date.
This matters because a speed test that reloads one URL cannot show everything a visitor experiences after a client-side route change. Live Metrics is a controlled diagnostic view. It helps locate a possible post-click problem; it does not replace field measurement, nor does its lab output alone state what Google Search uses for rankings.
What Is a Soft Navigation?
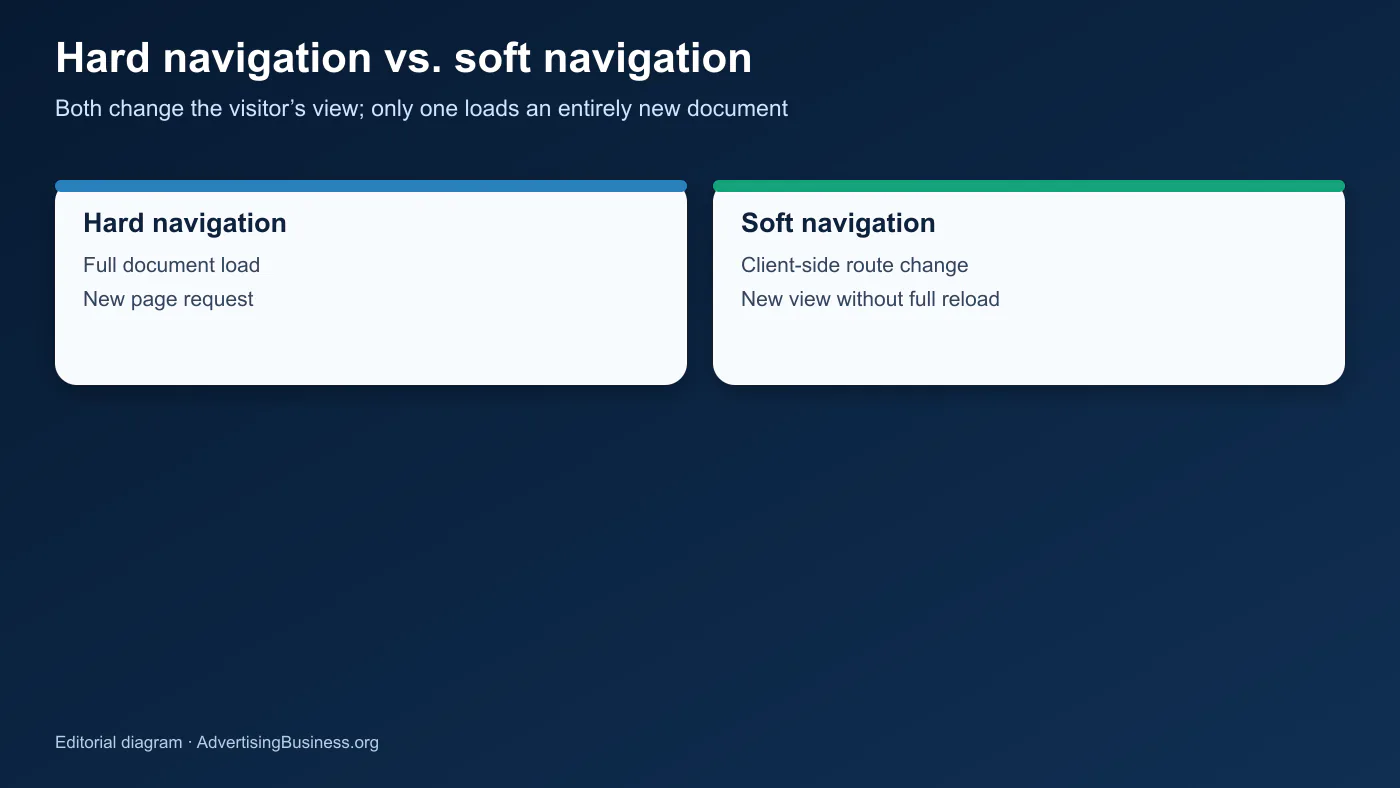
A soft navigation is a user-initiated change that updates the visible URL and paints a new view without loading an entirely new document. In a conventional hard navigation, the browser loads a new document. In an app-style website, JavaScript may change the route, fetch data and render the next view within the existing document. That can be quick—or it can introduce a visible wait after the click.
Why First-Load Tests Can Miss the Business Problem
Homepage-only testing answers a narrow question: how did the entry document perform in that test? It may miss a route that waits on a slow API, blocks the main thread during a filter interaction, shows a delayed hero image after a product click or becomes unstable as form components hydrate. Visitors do not experience a website as one audit score. They experience the path from ad, search result or referral through comparison, action and confirmation.
The commercial symptom may be a falling product-detail engagement rate, form abandonment after a service selection or support contacts that say “the page froze.” These are hypotheses, not proof that a single metric caused revenue movement. Compare before-and-after behavior, device type, route, acquisition source and field measurements before assigning cause.
Which Websites Are Most Affected?
Single-page applications and sites with client-side routing are the clearest candidates: React applications, many Next.js app experiences, dashboards, ecommerce filters, booking flows and configurators. A traditionally navigated content site may have fewer soft routes, but any user-driven view change that fits Chrome’s detection conditions can be worth inspecting. Chrome’s soft-navigation guidance notes detection can have false positives or negatives, so treat markers as useful evidence rather than a perfect map of user intent.
Measure the Customer Journey, Not Just the Entry Page
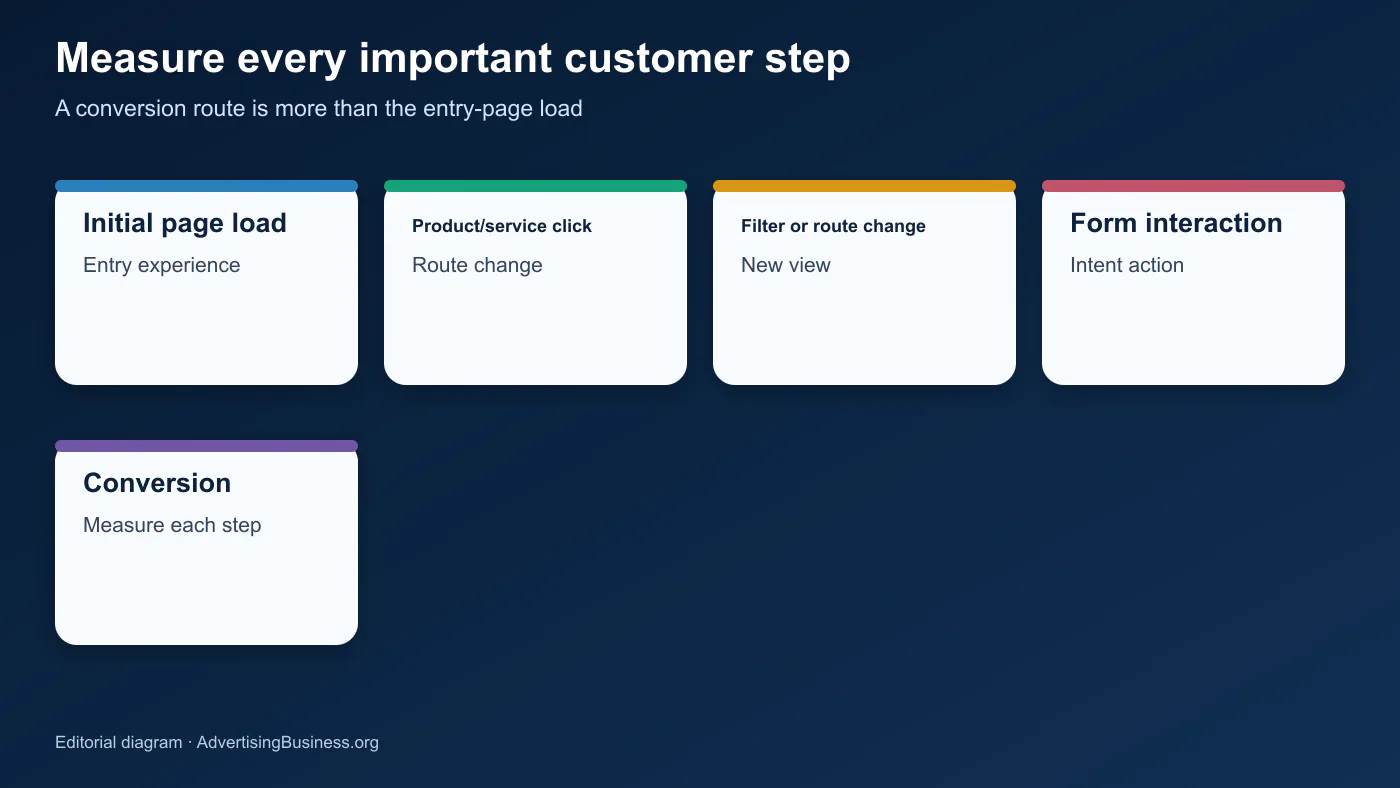
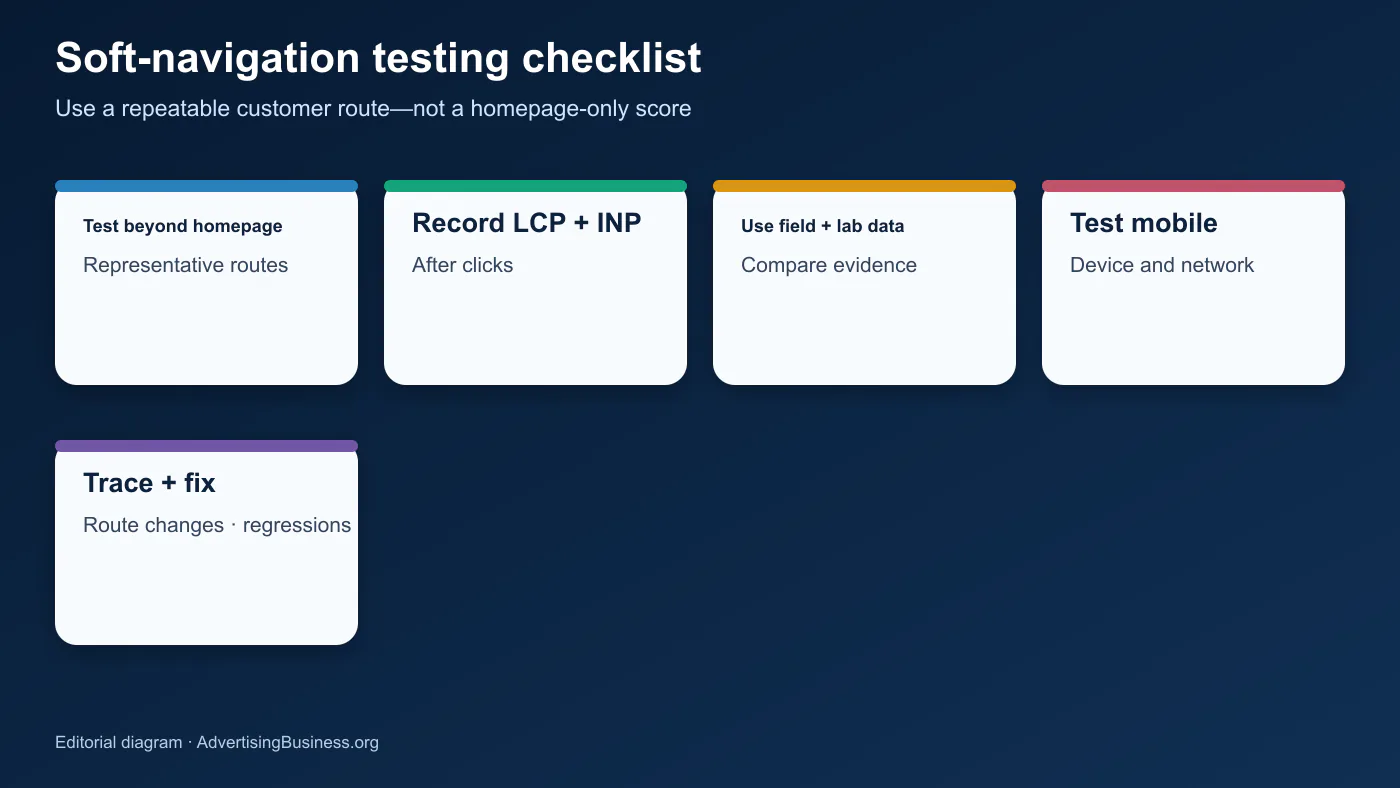
Map one real conversion route: initial page load, product or service click, filter or route change, form interaction and confirmation. Test the route on representative mobile hardware and network conditions, then repeat on desktop. Record which route changed, what content becomes visible, LCP after the click, INP for the initiating interaction and any layout shift. Pair that lab trace with real-user monitoring where supported, analytics funnels and session or support evidence.
Facts, Limits and Unknowns
Confirmed: Chrome 152 is currently stable as of August 30, 2026, and its DevTools Live Metrics supports detected soft-navigation Core Web Vitals by default. Important limit: Chrome’s documentation explains that the heuristic can miss or overcount what users perceive as a navigation, and older browsers or other browser engines may not report the same data. Analysis: a team should treat a lab regression as an investigation lead, then validate the route’s field experience and business outcome.
How Teams Should Test and Fix Regressions
First, reproduce the route with a short written test script. Second, compare an expected baseline with the problematic trace and identify the user-visible wait: data request, rendering work, image choice, third-party script or interaction handler. Third, fix one cause at a time, retest the journey and monitor real users after release. Keep a route-level release note so a conversion change has a technical timeline beside it.
Give the test a decision rule before looking at the chart. For example: a service-selection route that produces a slow visible update on mid-range mobile devices becomes a release blocker until the team identifies the cause or documents the trade-off. Keep synthetic runs repeatable, but do not hide a route from review because it is difficult to automate. The route that creates revenue, lead quality or support pressure deserves priority.
When a route looks slow, inspect what the user actually sees alongside the timing data. A skeleton that communicates progress may be less harmful than an unresponsive button with no feedback, even if both deserve engineering attention. Pair route metrics with errors, rage clicks, abandonment and support notes. This creates a practical bridge between a technical finding and the customer consequence that determines the fix order.
Chrome 152 soft navigation Core Web Vitals data should push web teams to test the full customer journey—not only the homepage or first page load.
Test the Experience After the First Click
Elite Web Professionals helps businesses connect Growth Engine Website performance work to the visitor journey: visibility, content, conversion paths and measurement rather than a one-page score. A route-level review can identify the post-click experiences that deserve testing first and turn the findings into an accountable improvement plan. See the Atlanta web design service for the conversion-focused website context behind this work.
Request a website journey performance review when your site relies on client-side routes, filters or multi-step conversion paths.
Frequently Asked Questions
What changed in Chrome 152 Live Metrics?
Chrome 152 Live Metrics now captures and reports Core Web Vitals such as LCP and INP for detected client-side soft navigations in single-page applications by default. Chrome attributes the change to web-vitals v6.0.0.
What is a soft navigation?
A soft navigation is a user-initiated visible route change that updates the URL and paints a new view without loading an entirely new document. It is common in app-style sites that use client-side routing.
Which websites are most affected by soft-navigation metrics?
Single-page applications, client-side routed React and Next.js experiences, dashboards, filters, booking flows and configurators are common candidates. Chrome’s detection is heuristic, so teams should verify whether a marker represents the user journey they intended to test.
Can a site pass the first-load test and still have poor Core Web Vitals later?
Yes. A page can perform well on its initial document load while a later route waits for data, runs expensive JavaScript or creates interaction delay. Test representative customer paths rather than inferring the full experience from one entry-page audit.
Which metrics should teams watch after a client-side navigation?
Start with LCP and INP, which Chrome names in its Live Metrics update, and inspect CLS in context. Pair route-level lab results with field data, device and network segmentation, analytics funnels and conversion behavior.
How should developers test React, Next.js, and other single-page applications?
Write a route-by-route customer journey script, test on representative mobile and desktop conditions, record the route transition and interaction metrics, find the user-visible cause, fix one change at a time and validate with field data after release.
KPIs to Track
- Route-level LCP, INP and CLS trends where measurement supports them
- Conversion and form-completion rate by route, device and source
- Error, abandonment and support-contact signals after clicks
- Regression detection and time-to-fix
What to Watch
- Chrome DevTools and web-vitals follow-up releases
- Soft-navigation detection limitations and browser support
- Real-user monitoring support for per-navigation metrics

 customersupport@advertisingbusiness.org
 (770) 874-6085